Two corn forecasts for one marketing year
Compare May and August 2024 WASDE projections for U.S. corn in 2024/25, preserving forecast dates, reported totals and stocks-to-use denominators.
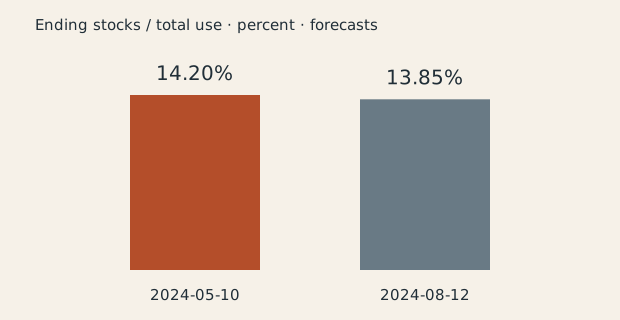
USDA's May 10, 2024 forecast put 2024/25 U.S. corn ending stocks at 2,102 million bushels and total use at 14,805 million. On August 12 the figures were 2,073 and 14,965 million. Projected stocks-to-use fell from 14.197906% to 13.852322%, a decrease of 0.345584 percentage points.
Match the commodity, column and marketing year
This study compares two preserved USDA World Agricultural Supply and Demand Estimates reports: WASDE-648 dated May 10, 2024 and WASDE-651 dated August 12, 2024. Both observations refer to projected U.S. corn supply and use for the 2024/25 marketing year, which begins September 1. The correct table is CORN on printed page twelve. The feed-grain aggregate above it uses different units and is not substituted for the corn balance.
Select the rightmost May column in the May report and the rightmost August column in the August report. Adjacent columns include earlier crop years and, in August, a July forecast. Treating the July number as May would produce a different revision comparison. The PDFs were retrieved on October 16, 2026, but their dated contents preserve these two forecast vintages. Neither column represents the realized outcome of the subsequently completed marketing year.
Calculate the ratio from reported stocks and total use
May projected ending stocks of 2,102 million bushels and total use of 14,805 million bushels. Dividing stocks by use and multiplying by one hundred gives 14.1979061128 percent. August projected ending stocks of 2,073 million and total use of 14,965 million, giving 13.8523220849 percent. Because the numerator and denominator share the same unit, the ratio is dimensionless. Mixing million bushels with a metric-ton figure would invalidate it.
The ratio change is minus 0.3455840279 percentage points. Ending stocks decreased by 29 million bushels while total use increased by 160 million. Both changes contribute to the lower ratio, so it is incomplete to explain it using only the stocks revision. This simple measure expresses projected carryout relative to projected annual use. It is not a forecast of price, a measure of immediately available export supplies or proof of a profitable directional trade.
| U.S. corn, million bushels | May 10 forecast | August 12 forecast | Revision |
|---|---|---|---|
| Beginning stocks | 2,022 | 1,867 | −155 |
| Production | 14,860 | 15,147 | +287 |
| Reported total supply | 16,907 | 17,038 | +131 |
| Reported total use | 14,805 | 14,965 | +160 |
| Ending stocks | 2,102 | 2,073 | −29 |
| Stocks-to-use | 14.197906% | 13.852322% | −0.345584 percentage points |
Reconcile the balance without double counting uses
The August forecast raises production by 287 million bushels compared with May, while beginning stocks fall by 155 million and imports remain 25 million. Reported total supply increases by 131 million. The August component sum is 17,039 million but its reported total is 17,038; USDA warns that displayed totals may not add because of rounding. The extract preserves both reported fields and the one-million-bushel discrepancy instead of silently forcing the table to balance.
Reported supply minus reported total use equals ending stocks in both selected columns. Within use, feed and residual rises from 5,750 to 5,825 million bushels; food, seed and industrial use falls from 6,855 to 6,840; exports rise from 2,200 to 2,300. Ethanol and by-products remain 5,450, but that line is already included in food, seed and industrial use. Adding it again would overstate consumption and destroy the intended denominator.
Preserve a vintage comparison as its own research result
The source footnotes also identify different information stages. May's corn yield projection uses a weather-adjusted trend and assumptions about planting progress and growing-season weather. The later report incorporates a subsequent information set. The comparison quantifies how the published forecast balance changed; it does not determine which individual new fact caused every revision. Nor does it assess forecast accuracy, which would require a separately identified later outcome and a predeclared scoring convention.
Download the two normalized records with their release dates, source URLs and PDF hashes. A reproduction should check the table title, marketing-year label, forecast status, units and rightmost month before calculating ratios. For market-response research, publication dates alone are insufficient: one would also need intraday release timing, contemporaneous expectations, executable prices and costs. This study stops at a verified agricultural balance revision and keeps that evidence separate from any hypothetical trading implementation.
Keep in the decision record
- Compare the same marketing year across preserved forecast vintages.
- Stocks-to-use depends on both ending stocks and total use.
- Retain reported rounding differences and avoid double counting ethanol.
Source notes
Source dates and scope matter. Historical inventory observations are retained snapshots; forecasts and synthetic curve assumptions are labelled separately. No investment outcome or product coverage is implied.
Continue the analysis
Calculate corn stocks-to-use from a dated balance sheet
Use consistent ending stocks, total use and marketing-year vintages before interpreting the ratio.
Decompose a crop forecast revision before interpreting it
Trace acreage, yield, supply and use changes while preserving each report’s information date.
Align grain balances to their marketing years
Translate crop-year labels into periods and avoid mixing old-crop, new-crop and calendar-year evidence.
Assemble a commodity dossier that preserves the question and evidence
Connect source definitions, dated inputs, calculations and limitations into a reproducible research note.
Version 1 · Published 16 October 2026. Inspect the method · Explore the data and curves