Natural gas in 2024: the seasonal surplus narrowed
Compare Lower 48 working-gas monthly means with equal-weight 2019–2023 monthly means while preserving weekly counts and the distinction from EIA's official comparison.
The 2024 March mean of weekly Lower 48 working-gas stocks was 2,309.2 Bcf, 38.457849% above this study's 2019–2023 March baseline. October averaged 3,746.25 Bcf, 4.403261% above its corresponding baseline. The absolute stock rose while the seasonal surplus narrowed; these are different comparisons.
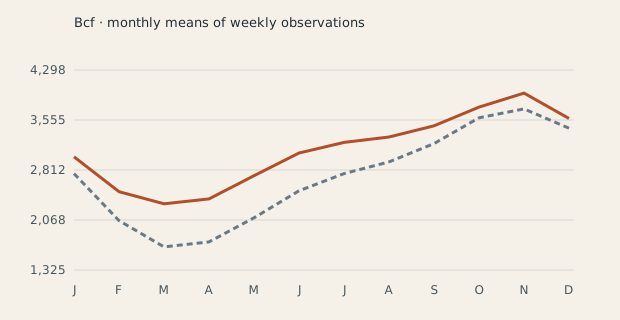
| Month | Weekly count | Mean (Bcf) | Prior-five-year mean |
|---|---|---|---|
| 1 | 4 | 3,008.25 | 2,758.41 |
| 2 | 4 | 2,489.50 | 2,058.95 |
| 3 | 5 | 2,309.20 | 1,667.80 |
| 4 | 4 | 2,381.25 | 1,742.71 |
| 5 | 5 | 2,726.40 | 2,100.79 |
| 6 | 4 | 3,063.75 | 2,502.26 |
| 7 | 4 | 3,222.00 | 2,757.48 |
| 8 | 5 | 3,302.80 | 2,932.58 |
| 9 | 4 | 3,468.25 | 3,203.92 |
| 10 | 4 | 3,746.25 | 3,588.25 |
| 11 | 5 | 3,955.20 | 3,719.60 |
| 12 | 4 | 3,577.75 | 3,432.27 |
Keep a seasonal stock comparison separate from a forecast
The gas study extracts the Total Lower 48 column from EIA's historical Weekly Natural Gas Storage Report workbook. All 313 selected observations from January 2019 through December 2024 are labelled EIA-912 in the source, and values remain in billion cubic feet, or Bcf. The selected quantity is working gas in underground storage. It should not be confused with total storage including base gas, daily supply or an estimate of future withdrawal capability.
The preserved workbook contains latest estimates as of October 15, 2026 and was retrieved the following day. That makes the comparison a historical snapshot with possible revisions, not a collection of original weekly releases. No release timestamp is reconstructed from a week-ending date. The 2024 subset contains fifty-two observations, with its weekly minimum of 2,259 Bcf on March 29 and maximum of 3,972 Bcf on November 8.
Construct the baseline in two explicit steps
For each calendar month, first average the weekly observations whose week-ending dates fall inside that month. Then average the five corresponding monthly means from 2019 through 2023, giving each year equal weight. This avoids giving a year with five reported Fridays more weight than one with four. The tool requires at least four observations in the selected month and every baseline month; otherwise it withholds that comparison and explains the missing coverage.
March's five baseline means are 1,192, 2,017, 1,772.25, 1,440.75 and 1,917 Bcf. Their arithmetic mean is 1,667.8 Bcf. The five March 2024 observations average 2,309.2 Bcf, a difference of 641.4 Bcf. Divide that difference by 1,667.8 and multiply by one hundred to obtain 38.457849 percent. The baseline range of 1,192 to 2,017 describes five monthly means, not every historical weekly observation or a confidence interval.
| Month | 2024 mean / count | Five-year monthly baseline | Difference |
|---|---|---|---|
| March | 2,309.20 Bcf / 5 | 1,667.80 Bcf | +641.40 Bcf / +38.457849% |
| June | 3,063.75 Bcf / 4 | 2,502.26 Bcf | +561.49 Bcf / +22.439315% |
| October | 3,746.25 Bcf / 4 | 3,588.25 Bcf | +158.00 Bcf / +4.403261% |
| December | 3,577.75 Bcf / 4 | 3,432.27 Bcf | +145.48 Bcf / +4.238594% |
Explain why the level and surplus can move differently
October's four 2024 observations average 3,746.25 Bcf against a baseline of 3,588.25, leaving a 158 Bcf surplus. Stocks are much higher than the March mean, yet the percentage surplus is smaller because the seasonal comparison level has also risen. All twelve 2024 monthly means exceed their corresponding baseline means in this retained dataset. That does not mean every month exceeds the maximum of its five historical monthly means; October, for example, remains below that maximum.
EIA's August 7, 2024 discussion provides seasonal context: inventories generally build during April–October and fall during November–March, with regional exceptions. Its projections in that article are forecasts made then, not the later observations used here. The regional and weather explanations in EIA's discussion help identify questions for further work, but this national descriptive comparison alone cannot isolate the contribution of temperature, production, power demand, exports or storage-operator decisions.
State the methodological difference before reusing the result
EIA's official weekly five-year statistics use a daily interpolation method to align historical comparisons. Our calendar-month mean-of-year-means is deliberately simpler and answers a different question. It should never be labelled the official EIA five-year weekly surplus. Compare the downloadable counts and formulas before placing either statistic beside another chart. A month average is also different from an end-of-month balance, even when both are described informally as March inventories.
Use the explorer to replay March, June and October, then retain the input data, report and provenance. No price or futures-curve series enters the calculation. A positive seasonal surplus is therefore not a measured short signal, and a narrowing surplus is not a demonstrated price catalyst. A further research design would need timed releases, regional context, price conventions and a separate validation plan before making claims about an investable relationship.
Keep in the decision record
- Absolute inventories and surplus against a seasonal baseline can move differently.
- Equal weighting of annual monthly means makes the local convention explicit.
- This study does not reproduce EIA's official weekly interpolation method.
Source notes
- EIA: historical weekly working-gas workbook
- EIA: weekly gas-storage methodology
- EIA, August 7, 2024: seasonal inventory context
Source dates and scope matter. Historical inventory observations are retained snapshots; forecasts and synthetic curve assumptions are labelled separately. No investment outcome or product coverage is implied.
Continue the analysis
Distinguish working gas, base gas and storage deliverability
Interpret natural-gas inventory volumes without treating them as capacity or immediately deliverable supply.
Compare calendar months without confusing observation weights
Reproduce monthly inventory means and an equal-weight five-year reference, with explicit completeness rules.
Read gas injection and withdrawal seasons as tendencies
Compare seasonal starting levels, net changes and regional conditions without treating calendar boundaries as physical switches.
Describe commodity seasonality without promising a forecast
Use historical monthly comparisons as context while preserving uncertainty, structural change and vintage limits.
Version 1 · Published 16 October 2026. Inspect the method · Explore the data and curves