The 2020 crude build: a peak is different from a year-end change
Trace U.S. commercial crude stocks from 431.060 million barrels to a June peak of 540.722 million, using a preserved EIA history and explicit endpoints.
In the retrieved EIA history, U.S. commercial crude stocks excluding SPR rose from 431.060 million barrels on January 3, 2020 to 540.722 million on June 19. They ended the observed year at 493.469 million. The peak build was 109.662 million barrels; the first-to-last increase was 62.409 million.
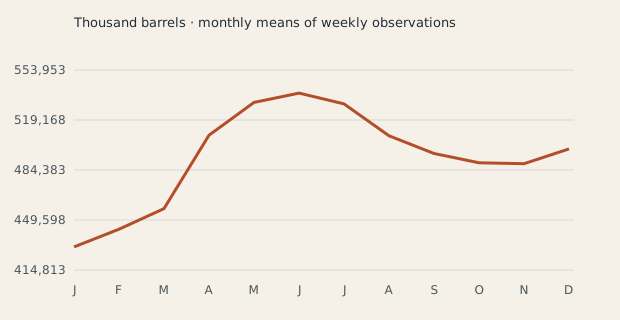
| Month | Weekly count | Mean (thousand barrels) | Prior-five-year mean |
|---|---|---|---|
| 1 | 5 | 430,868.00 | Unavailable |
| 2 | 4 | 443,201.25 | Unavailable |
| 3 | 4 | 457,518.25 | Unavailable |
| 4 | 4 | 508,564.75 | Unavailable |
| 5 | 5 | 531,391.60 | Unavailable |
| 6 | 4 | 537,898.50 | Unavailable |
| 7 | 5 | 530,402.80 | Unavailable |
| 8 | 4 | 508,175.00 | Unavailable |
| 9 | 4 | 495,827.75 | Unavailable |
| 10 | 5 | 489,399.80 | Unavailable |
| 11 | 4 | 488,736.00 | Unavailable |
| 12 | 4 | 499,082.50 | Unavailable |
Define the stock before interpreting its change
This study uses EIA series WCESTUS1: weekly U.S. ending stocks of crude oil excluding the Strategic Petroleum Reserve. The normalized download preserves the source unit, thousand barrels, and all observations dated in 2019 through 2024. For 2020 there are fifty-two weekly observations. These are stocks measured at successive week endings, not weekly production, refinery demand, imports or a direct measure of the amount of storage available to a new trader.
The raw workbook was retrieved on October 16, 2026 and identifies an October 15 release. Consequently, this is a reproducible analysis of a retrieved historical series that can incorporate revisions. It is not a reconstruction of exactly what was known at each 2020 release time. The source workbook and its SHA-256 hash are retained, while every selected crude observation was independently matched against EIA's separate HTML history before analysis.
Measure the build with named endpoints
Select crude and 2020 in the inventory explorer. The first recorded date is January 3 at 431,060 thousand barrels. The maximum within the selected year occurs on June 19 at 540,722. Subtracting the first value from the peak gives 109,662 thousand barrels, or 109.662 million barrels. Dividing that increase by the first value gives 25.440078 percent. These numbers describe the chosen stock series and endpoints, not a return earned by an investor.
The last available 2020 observation is December 25 at 493,469 thousand barrels. The first-to-last increase is therefore 62,409 thousand barrels, or 14.478031 percent. Between the June peak and December 25, the recorded stock fell by 47,253 thousand barrels. A year-end summary alone would hide much of the earlier accumulation and later drawdown. Calling these first and last observations avoids implying that January 1 and December 31 were directly measured.
| Observation or calculation | Thousand barrels | Interpretation |
|---|---|---|
| January 3, 2020 | 431,060 | First selected observation |
| June 19, 2020 | 540,722 | Selected-year maximum |
| December 25, 2020 | 493,469 | Last selected observation |
| First to peak | +109,662 | +25.440078% of first value |
| First to last | +62,409 | +14.478031% of first value |
| Peak to last | −47,253 | Reduction after selected peak |
Use dated context without importing a price signal
EIA's June 29, 2020 analysis described the June 19 level as an all-time high of approximately 541 million barrels and connected the accumulation to reduced petroleum-product demand. That contemporary explanation supplies context for the historical pattern. This publication's normalized window covers only 2019–2024, so it independently establishes the selected-window maximum; the broader all-time description is attributed to EIA's dated article rather than inferred from a six-year extract.
Commercial stocks include more than liquid sitting in readily rentable tanks. EIA explains that the total includes pipeline fill and stocks in transit, while its storage-utilization calculations make additional adjustments. National inventory therefore cannot identify a specific terminal's capacity, deliverable grade, transport access or usable storage contract. The study includes no futures price history and cannot establish whether a curve trade, physical storage transaction or directional position would have been profitable.
Reproduce the path without manufacturing a baseline
The explorer also groups week-ending observations by calendar month. January's five observations average 430,868 thousand barrels and June's four average 537,898.5. These are arithmetic means of weekly stock observations, not summed flows or time-weighted monthly quantities. Keep the counts alongside the values. When selecting 2020, the five-prior-year comparison remains unavailable because the retained extract begins in 2019; it would be misleading to label the single earlier year a five-year baseline.
Download the underlying observations and the report together with the public provenance record. A reproducible conclusion names the series, exclusions, unit, retrieval basis, endpoint dates and calculation. An investment hypothesis would need separate evidence about prices, delivery terms, information timing, transaction costs and prospective evaluation. Preserving these boundaries makes the inventory study useful on its own: it quantifies a substantial accumulation and subsequent partial reversal without assigning an unsupported trading outcome to that history.
Keep in the decision record
- A peak build and a first-to-last change answer different questions.
- Commercial stocks exclude SPR but do not equal freely available storage capacity.
- Retrieved historical observations do not reconstruct real-time information availability.
Source notes
- EIA: weekly commercial crude stocks excluding SPR
- EIA: original series workbook
- EIA, June 29, 2020: commercial crude inventory context
Source dates and scope matter. Historical inventory observations are retained snapshots; forecasts and synthetic curve assumptions are labelled separately. No investment outcome or product coverage is implied.
Continue the analysis
Interpret commercial crude stocks within their reporting boundary
Separate commercial inventories, strategic reserves and flow measures before discussing a crude-oil balance.
Reconcile stock changes before calling them physical flows
Track additions, withdrawals and classification changes in an explicit inventory bridge.
Preserve the release vintage behind an inventory claim
Separate observation dates, publication dates and retrieval dates in historical commodity studies.
Convert commodity units without losing physical meaning
Distinguish volume, mass, energy and quoted contract units in reproducible calculations.
Version 1 · Published 16 October 2026. Inspect the method · Explore the data and curves